

Analytics
Understand where every performance number comes from, not just what it says.
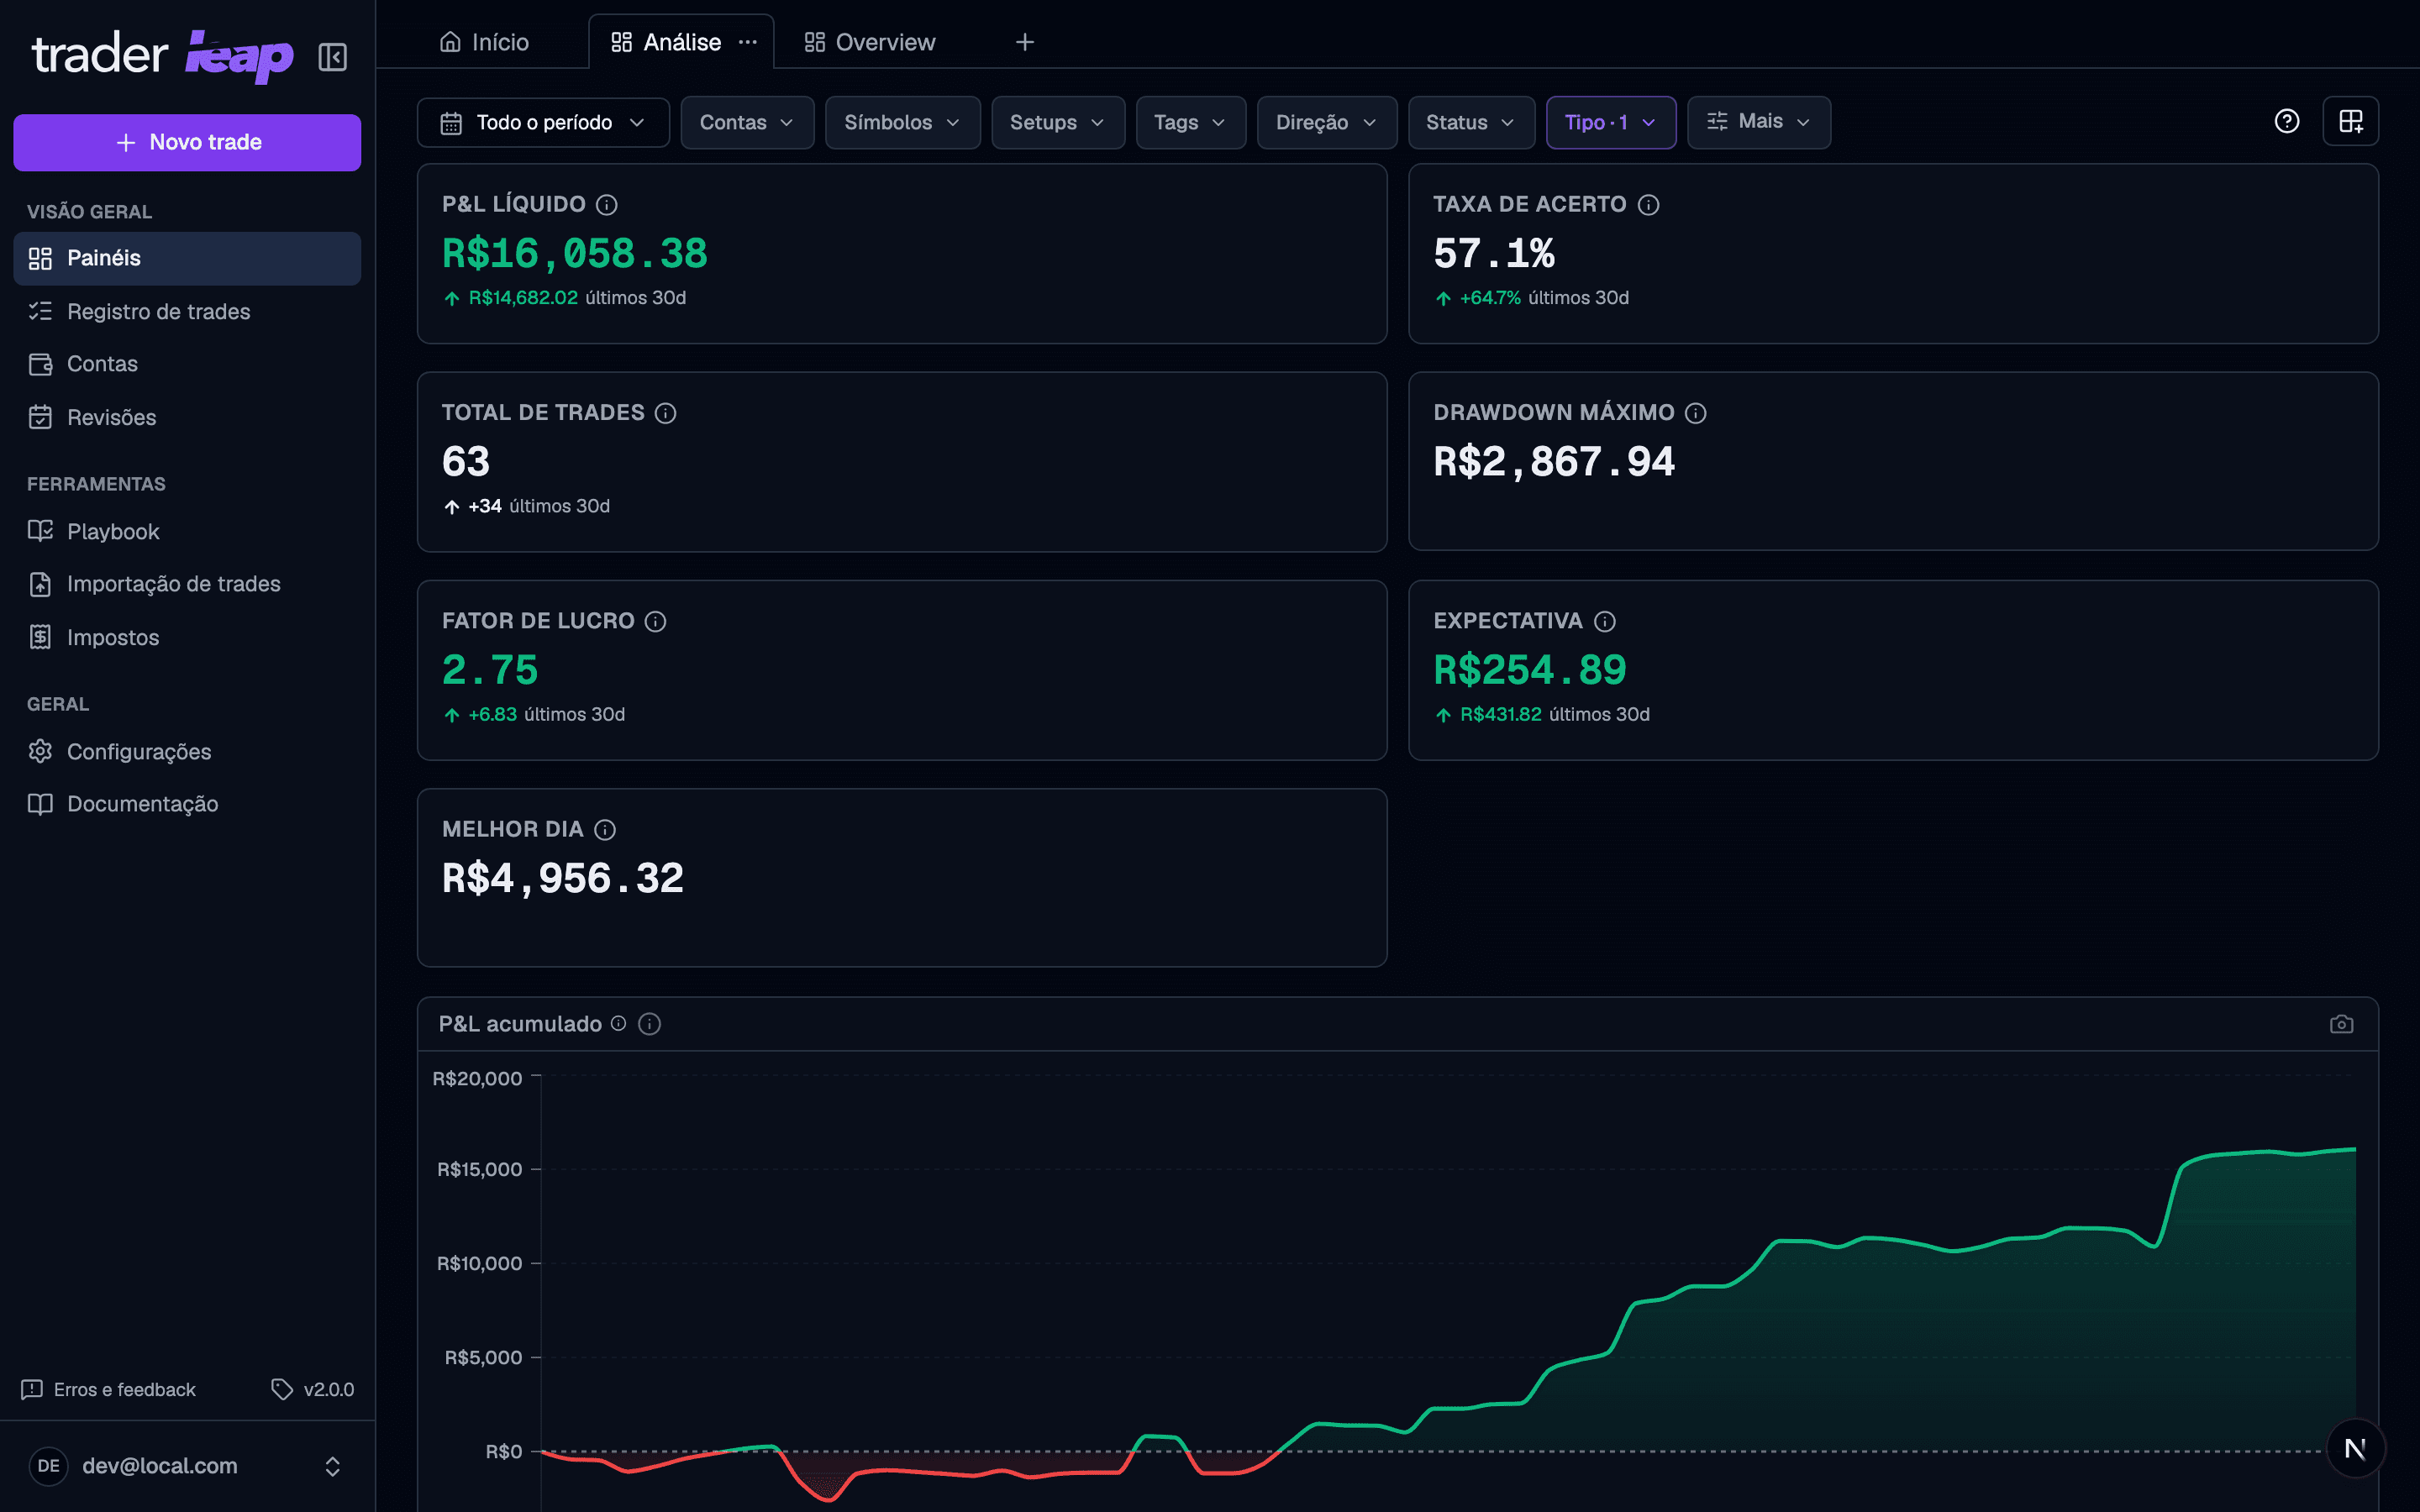
Analytics turns your closed trades into performance metrics: PnL, win rate, profit factor, expectancy, drawdown, and more.
Where you give money back
You don't have to hunt for the pattern that's costing you: the Evidence Coach reads your record, names the costliest leak and the best-paying strength in money, and cites the exact trades behind each. The filters are still there for going deeper: slice by setup, session, or symbol. Sometimes it isn't a bad market, just the same setup repeated at hours or on symbols where it simply doesn't work.
Break-even: what counts as a win or a loss
Every trade is classified as a win, loss, or break-even based on a configurable range in Settings > Trading:
- Fixed range: a P&L interval (for example, between -$5 and $5) stays out of the win and loss counts.
- % of balance: the range is a percentage of the account balance. One important detail here: the balance used is what the account had at the moment that trade was opened (starting capital plus the net result of everything before it), not the account's current balance. This keeps the classification of older trades stable as the account grows, instead of reclassifying the entire history every time the balance changes.
Drawdown: two numbers, two places
The Analytics drawdown is computed on the cumulative PnL curve: it marks peaks, valleys, and the duration of each decline. It's the number that reflects the account's real history.
Some Home widgets show a different indicator: drawdown limit used. That's a simple comparison between the current balance and a configured limit, without looking at the curve. The two numbers are not the same thing: one shows the size and duration of real declines, the other only warns when you're close to your limit. The daily loss limit works like the second kind, per session; see Accounts for how both limits are configured.
Trading score
The trading score sums up six axes of your performance — profitability, risk management, execution, consistency, return consistency, and experience — into a score from 0 to 100.
The score is only computed with at least 5 trades and 4 active weeks of history. Below that, the score shows as 0, which means "not enough sample", not "bad performance".
Best hours
The best-hours panel points to the windows of the day with your best results. It needs a reasonable volume of trades to call an hour with confidence; with few trades logged, the reading isn't reliable yet.
Best hours is part of every plan; the trading score is part of the Trader and Premium plans.